![]() Home
Home
![]() Products
Products
![]()
![]() IASopen
IASopen
![]()
![]()
![]() IASopen Modules
IASopen Modules
![]()
![]()
![]()
![]() Configurations
Configurations
![]()
![]()
![]()
![]() Type declarations
Type declarations
![]()
![]()
![]()
![]() Program organization...
Program organization...
![]()
![]()
![]()
![]() Data bases
Data bases
![]()
![]()
![]()
![]() Data loggings
Data loggings
![]()
![]()
![]()
![]() Alarm loggings
Alarm loggings
![]()
![]()
![]()
![]() Message loggings
Message loggings
![]()
![]()
![]()
![]() Recipes
Recipes
![]()
![]()
![]()
![]() Visualizations
Visualizations
![]()
![]()
![]()
![]() Reports
Reports
![]()
![]()
![]()
![]() User managements
User managements
![]()
![]()
![]()
![]() Language managements
Language managements
![]()
![]()
![]() Version informations
Version informations
![]()
![]()
![]()
![]() Build 850 - Build 800
Build 850 - Build 800
![]()
![]()
![]()
![]() Build 800 - Build 750
Build 800 - Build 750
![]()
![]()
![]()
![]() Build 750 - Build 700
Build 750 - Build 700
![]()
![]()
![]()
![]() Build 700 - Build 650
Build 700 - Build 650
![]()
![]()
![]()
![]() Build 650 - Build 600
Build 650 - Build 600
![]()
![]()
![]()
![]() Build 600 - Build 550
Build 600 - Build 550
![]()
![]()
![]()
![]() Build 550 - Build 500
Build 550 - Build 500
![]()
![]()
![]()
![]() Build 500 - Build 450
Build 500 - Build 450
![]()
![]()
![]()
![]() Build 450 - Build 400
Build 450 - Build 400
![]()
![]()
![]() Download
Download
![]()
![]()
![]() Hardware requirements
Hardware requirements
![]()
![]()
![]() Software requirements
Software requirements
![]()
![]()
![]() Scope of delivery
Scope of delivery
![]()
![]()
![]() Training
Training
![]()
![]() Project engineering
Project engineering
![]() Company
Company
![]() Contact
Contact
![]() Imprint
Imprint
![]() Privacy policy
Privacy policy
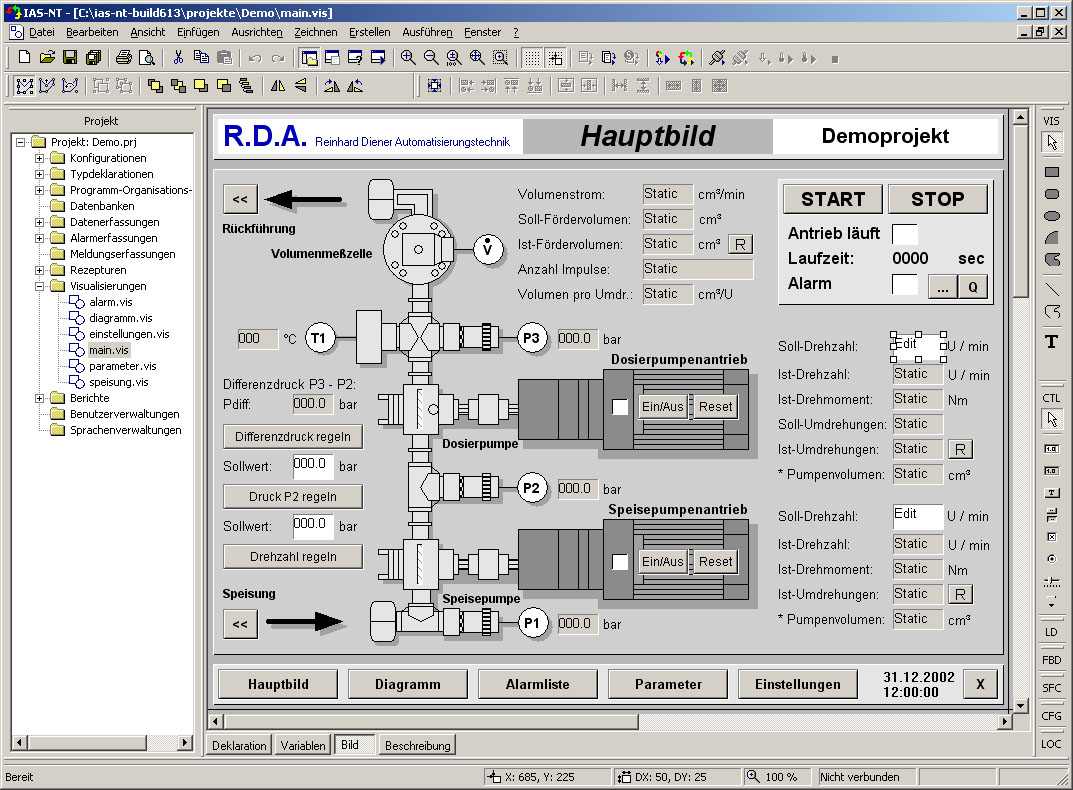
Visualizations
General
With the built-in visualization module, process images, or user images can be created where system conditions are graphically animated and interventions in the process controls can be performed.
The creation of visualization images will be done in the graphics editor, which provides both standard vector graphics objects vector graphic objects and controls .
All graphic objects can be animated dynamicalleyt at run time.
Event code execution is possible.
A comprehensive symbol library is included in the scope of delivery.
Vector graphic objects
As a vector graphic elements are available:
Rectangle
Rounded rectangle
Ellipse/circle
Circle cutting
Polygon
Line
Polyline
Text box
Controls
As controls are available:
Input field
Output field
Button
Exchange desk
Selection box
Selection switch
Slider
On-off switch
ScrollBar
Group box
Combo box
List box
Date/time control
YT curve chart
Chart
Alarm list
Registration list
Image control
Video control
Timeline control
All these elements have a variety of properties that are sometimes static, partly dynamic.
Dynamic animation
With dynamic animation properties can be changed graphic objects depending on current variable values or expressions.
Here are available:
Dynamic color change
Filling of objects
Moving objects (translation)
Scale of objects
Rotate objects
Change visibility
Change interlock
Structured text (ST) is used for the input variables and expressions.
Event code
Controls are capable of run event code, so that small parts, such as, for example, a picture switch directly in the visualization with structured text (ST) can be programmed very easy. Typical events like "Click", "Double Click", etc. are supported at this point.
Symbol library
Further, the graphics editor includes a symbol library, in which all standard symbols already exist (containers, valves, pumps etc.).
Diener
automation GmbH & Co. KG
Kapellenweg 21
D-51580 Reichshof
Phone
+49 (0)2265 / 99745-0
Fax
+49 (0)2265 / 99745-20
E-Mail
info@diener-automation.de